Live View
The live view is the focal point of Logfire, where you can see traces arrive in real-time.
The live view is useful for watching what's going on within your application in real-time (as the name suggests). You can also explore historical data in the search pane.
SQL search pane
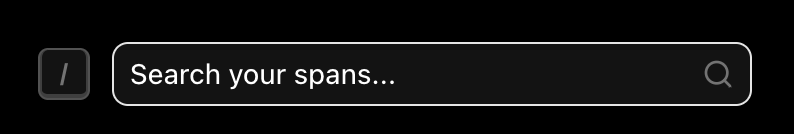
To search the live view, click Search your spans (keyboard shortcut /), this opens the search pane:
SQL Search
For confident SQL users, write your queries directly here. For devs who want a bit of help,
try the new PydanticAI feature which generates a SQL query based on your prompt.
You can also review the fields available and populate your SQL automatically using the Reference list, see more on this below.
WHERE clause
As the greyed out SELECT * FROM RECORDS WHERE implies, you're searching inside the WHERE clause of a SQL query.
It has auto-complete & schema hints, so try typing something to get a reminder. To run your query click Run or
keyboard shortcut cmd+enter (or ctrl+enter on Windows/Linux).
Note: you can run more complex queries on the explore screen
The schema for the records table is:
CREATE TABLE records AS (
    start_timestamp timestamp with time zone,
    created_at timestamp with time zone,
    trace_id text,
    span_id text,
    parent_span_id text,
    kind span_kind,
    end_timestamp timestamp with time zone,
    level smallint,
    span_name text,
    message text,
    attributes_json_schema text,
    attributes jsonb,
    tags text[],
    otel_links jsonb,
    otel_events jsonb,
    is_exception boolean,
    otel_status_code status_code,
    otel_status_message text,
    otel_scope_name text,
    otel_scope_version text,
    otel_scope_attributes jsonb,
    service_namespace text,
    service_name text,
    service_version text,
    service_instance_id text,
    process_pid integer
)
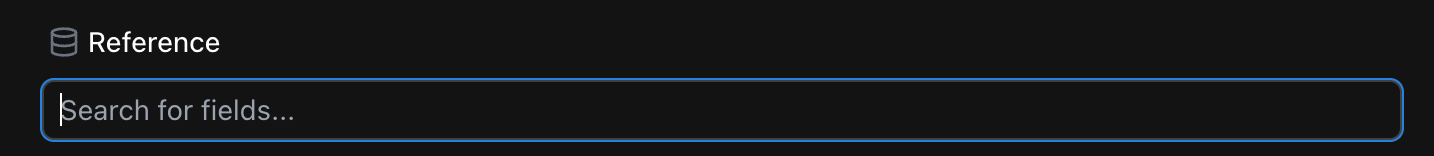
You can search for any of these in the Reference list:
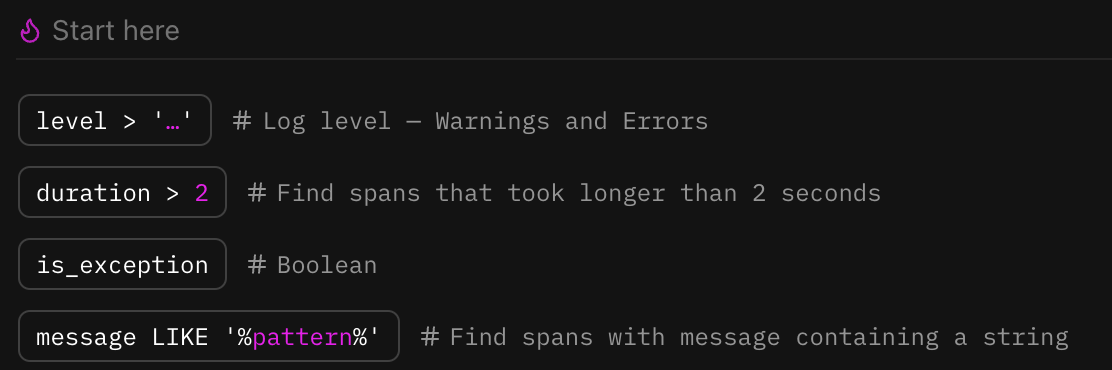
If you're not sure where to start, scroll down to the Start here for beginner-friendly suggestions.
Ask in Language -> Get SQL
Write your question in your native language, and the model will convert that question to a SQL query.
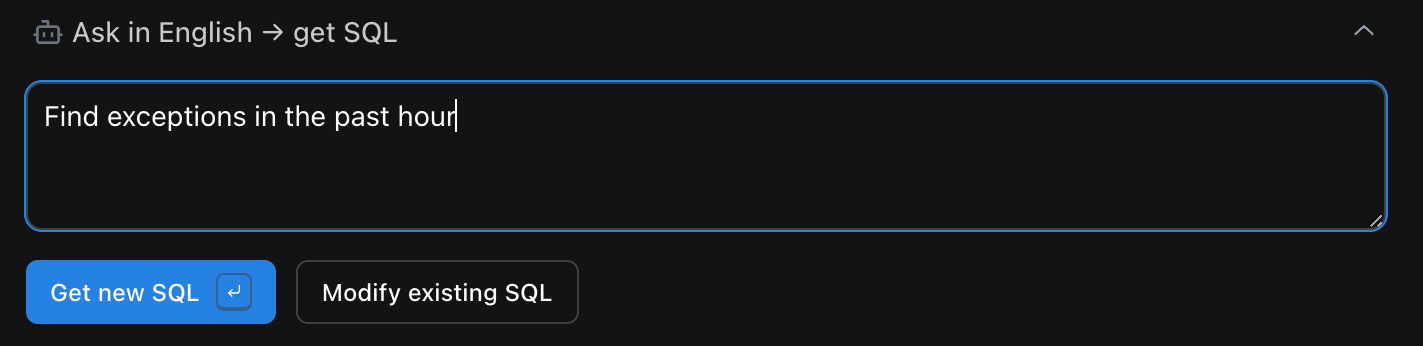
This is useful if you're not confident with SQL and/or can't quite remember how to format more complicated clauses. You have the option to create a completely new query with Get new SQL, or (if you have some SQL already) modify the existing query with Modify existing SQL.
Under the hood this feature uses an LLM running with PydanticAI.
Reference
Reference: A list of pre-populated query clauses. Clicking any of the clauses will populate the SQL editor, and (where applicable) you can choose a value from the autopopulated dropdown.
This list gives you a powerful way to rapidly generate the query you need, while simultaneously
learning more about all the ways you can search your data. Clicking multiple clauses will add them
to your query with a SQL AND statement. If you'd like something other than an AND statement, you
can replace this with alternative SQL operators like OR, or NOT.
Details panel closed
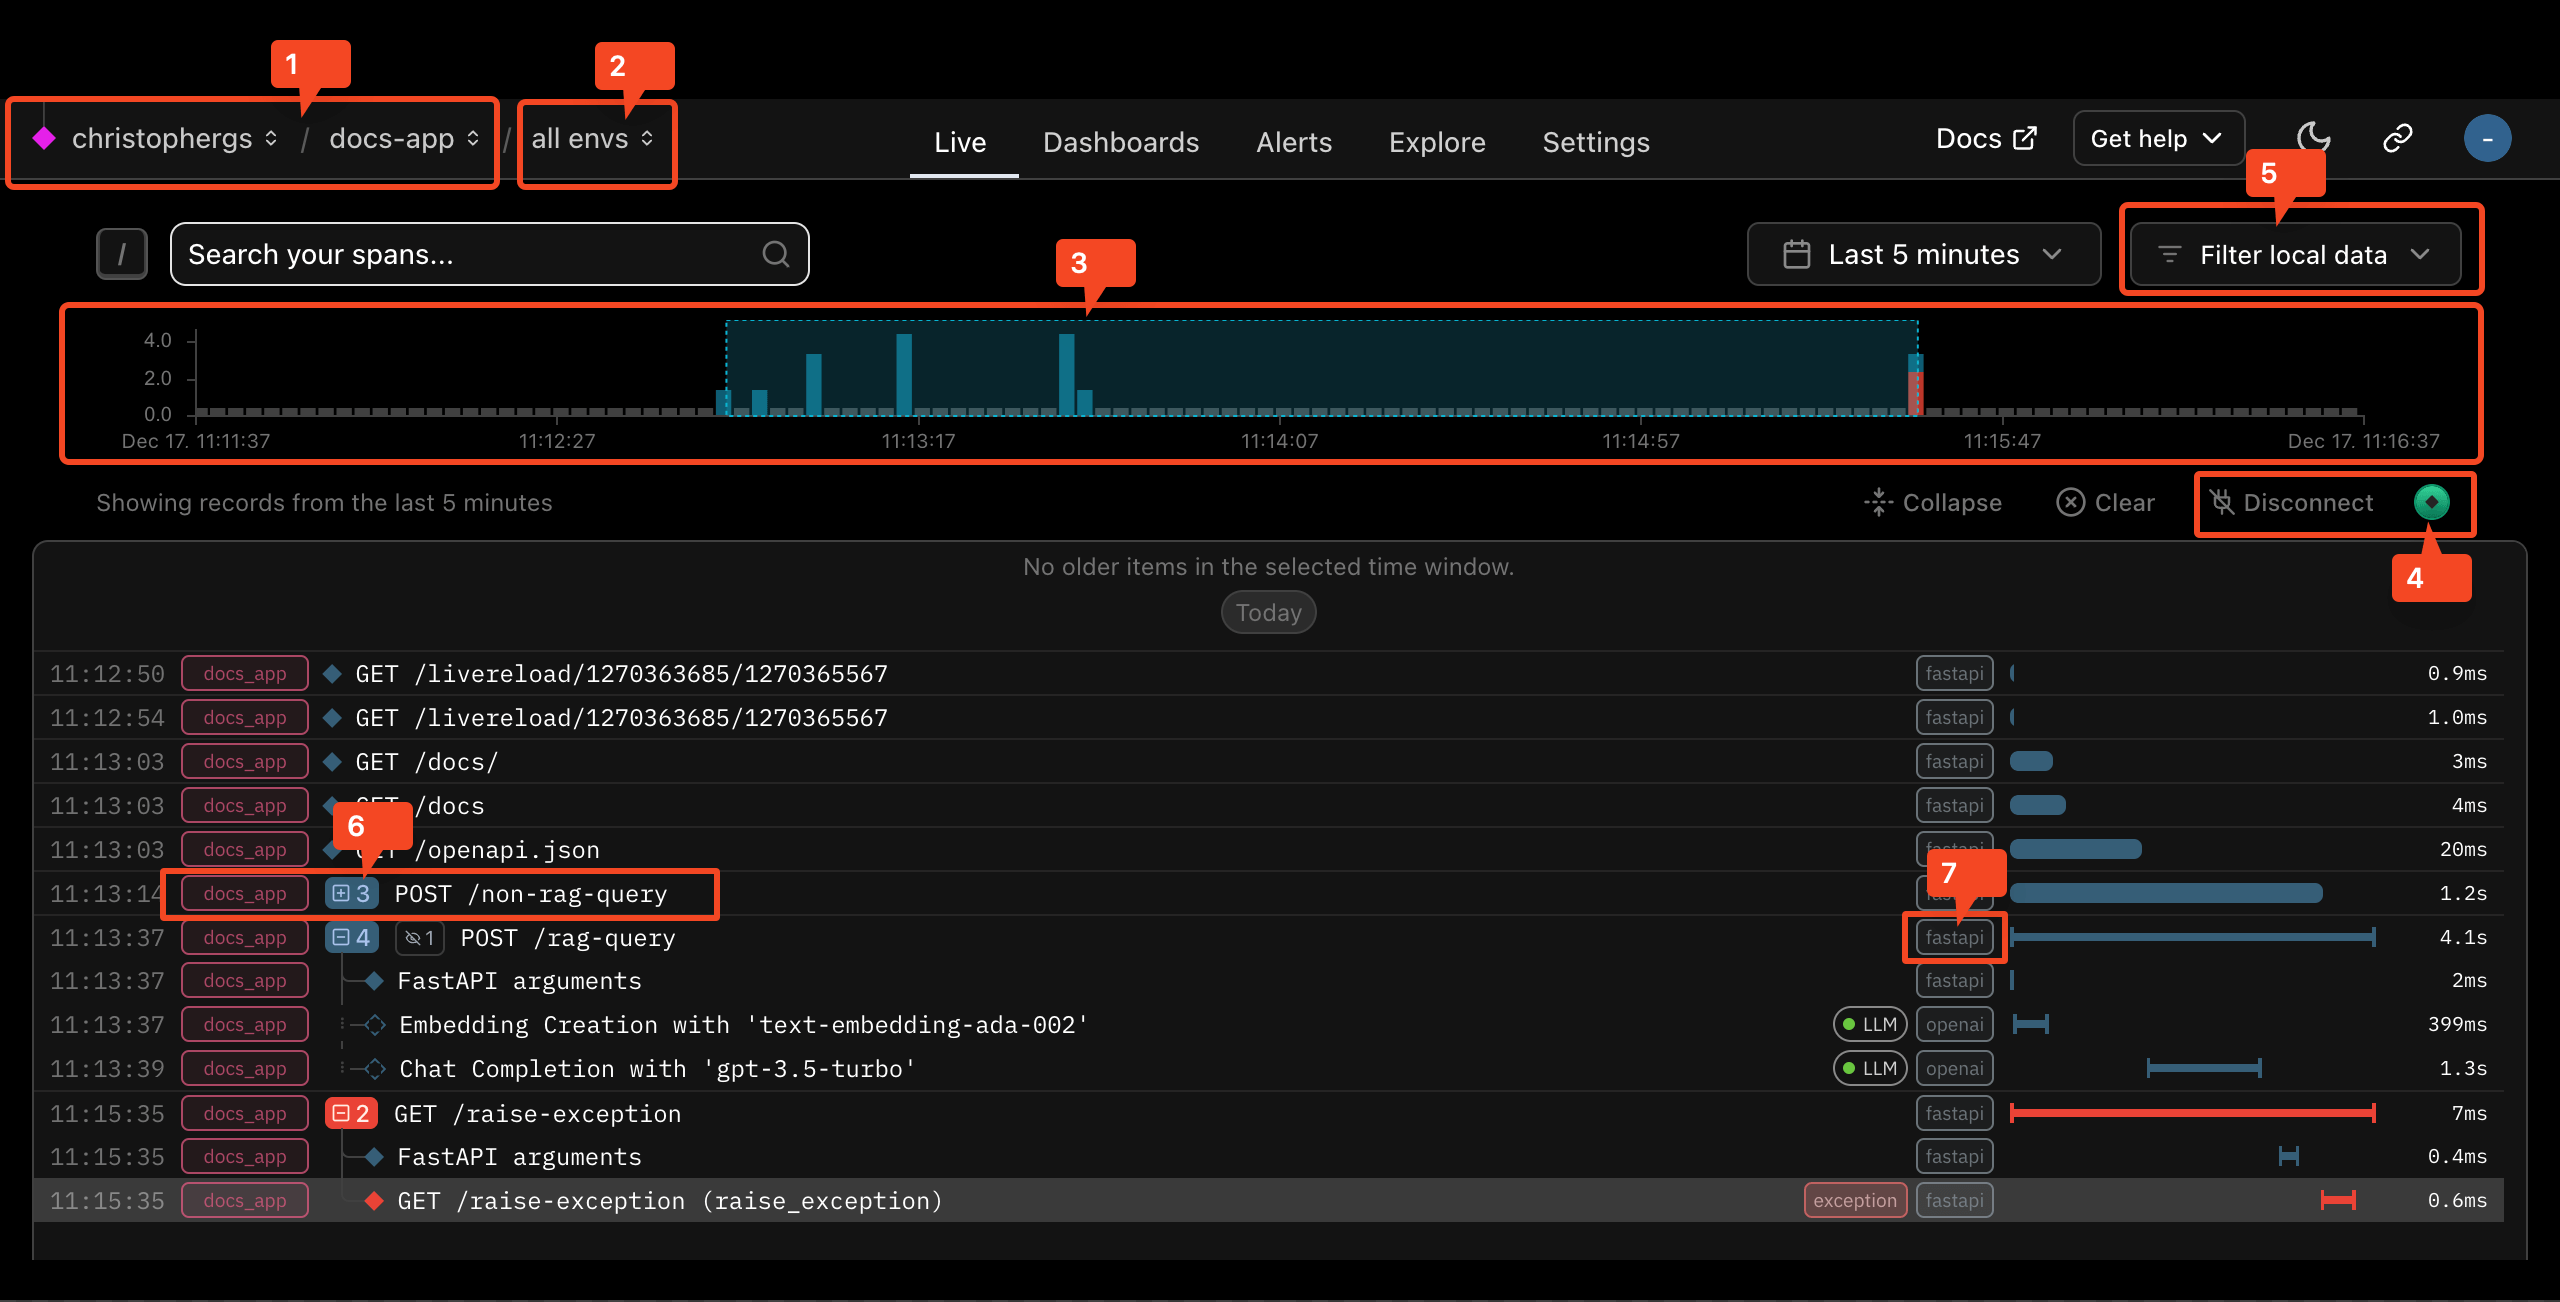
This is what you'll see when you come to the live view of a project with some data.
-
Organization and project labels: In this example, the organization is
christophergs, and the project isdocs-app. You can click the organization name to go to the organization overview page; the project name is a link to this page. -
Environment: In the above screenshot, this is set to
all envs. See the environments docs for details. -
Timeline: This shows a histogram of the counts of spans matching your query over time. The blue-highlighted section corresponds to the time range currently visible in the scrollable list of traces below. You can click at points on this line to move to viewing logs from that point in time.
-
Status label: This should show "Connected" if your query is successful and you are receiving live data. If you have a syntax error in your query or run into other issues, you should see details about the problem here.
-
Level, Service, scope, and tags visibility filters: Here you can control whether certain spans are displayed based on their level, service, scope, or tags. Important note: this only filters data currently on the screen.
-
A collapsed trace: The
+symbol to the left of the span message indicates that this span has child spans, and can be expanded to view them by clicking on the+button. -
Scope label: This pill contains the
otel_scope_nameof the span. This is the name of the OpenTelemetry scope that produced the span. Generally, OpenTelemetry scopes correspond to instrumentations, so this generally gives you a sense of what library's instrumentation produced the span. This will be logfire when producing spans using the logfire APIs, but will be the name of the OpenTelemetry instrumentation package if the span was produced by another instrumentation. You can hover to see version info.
Details panel open
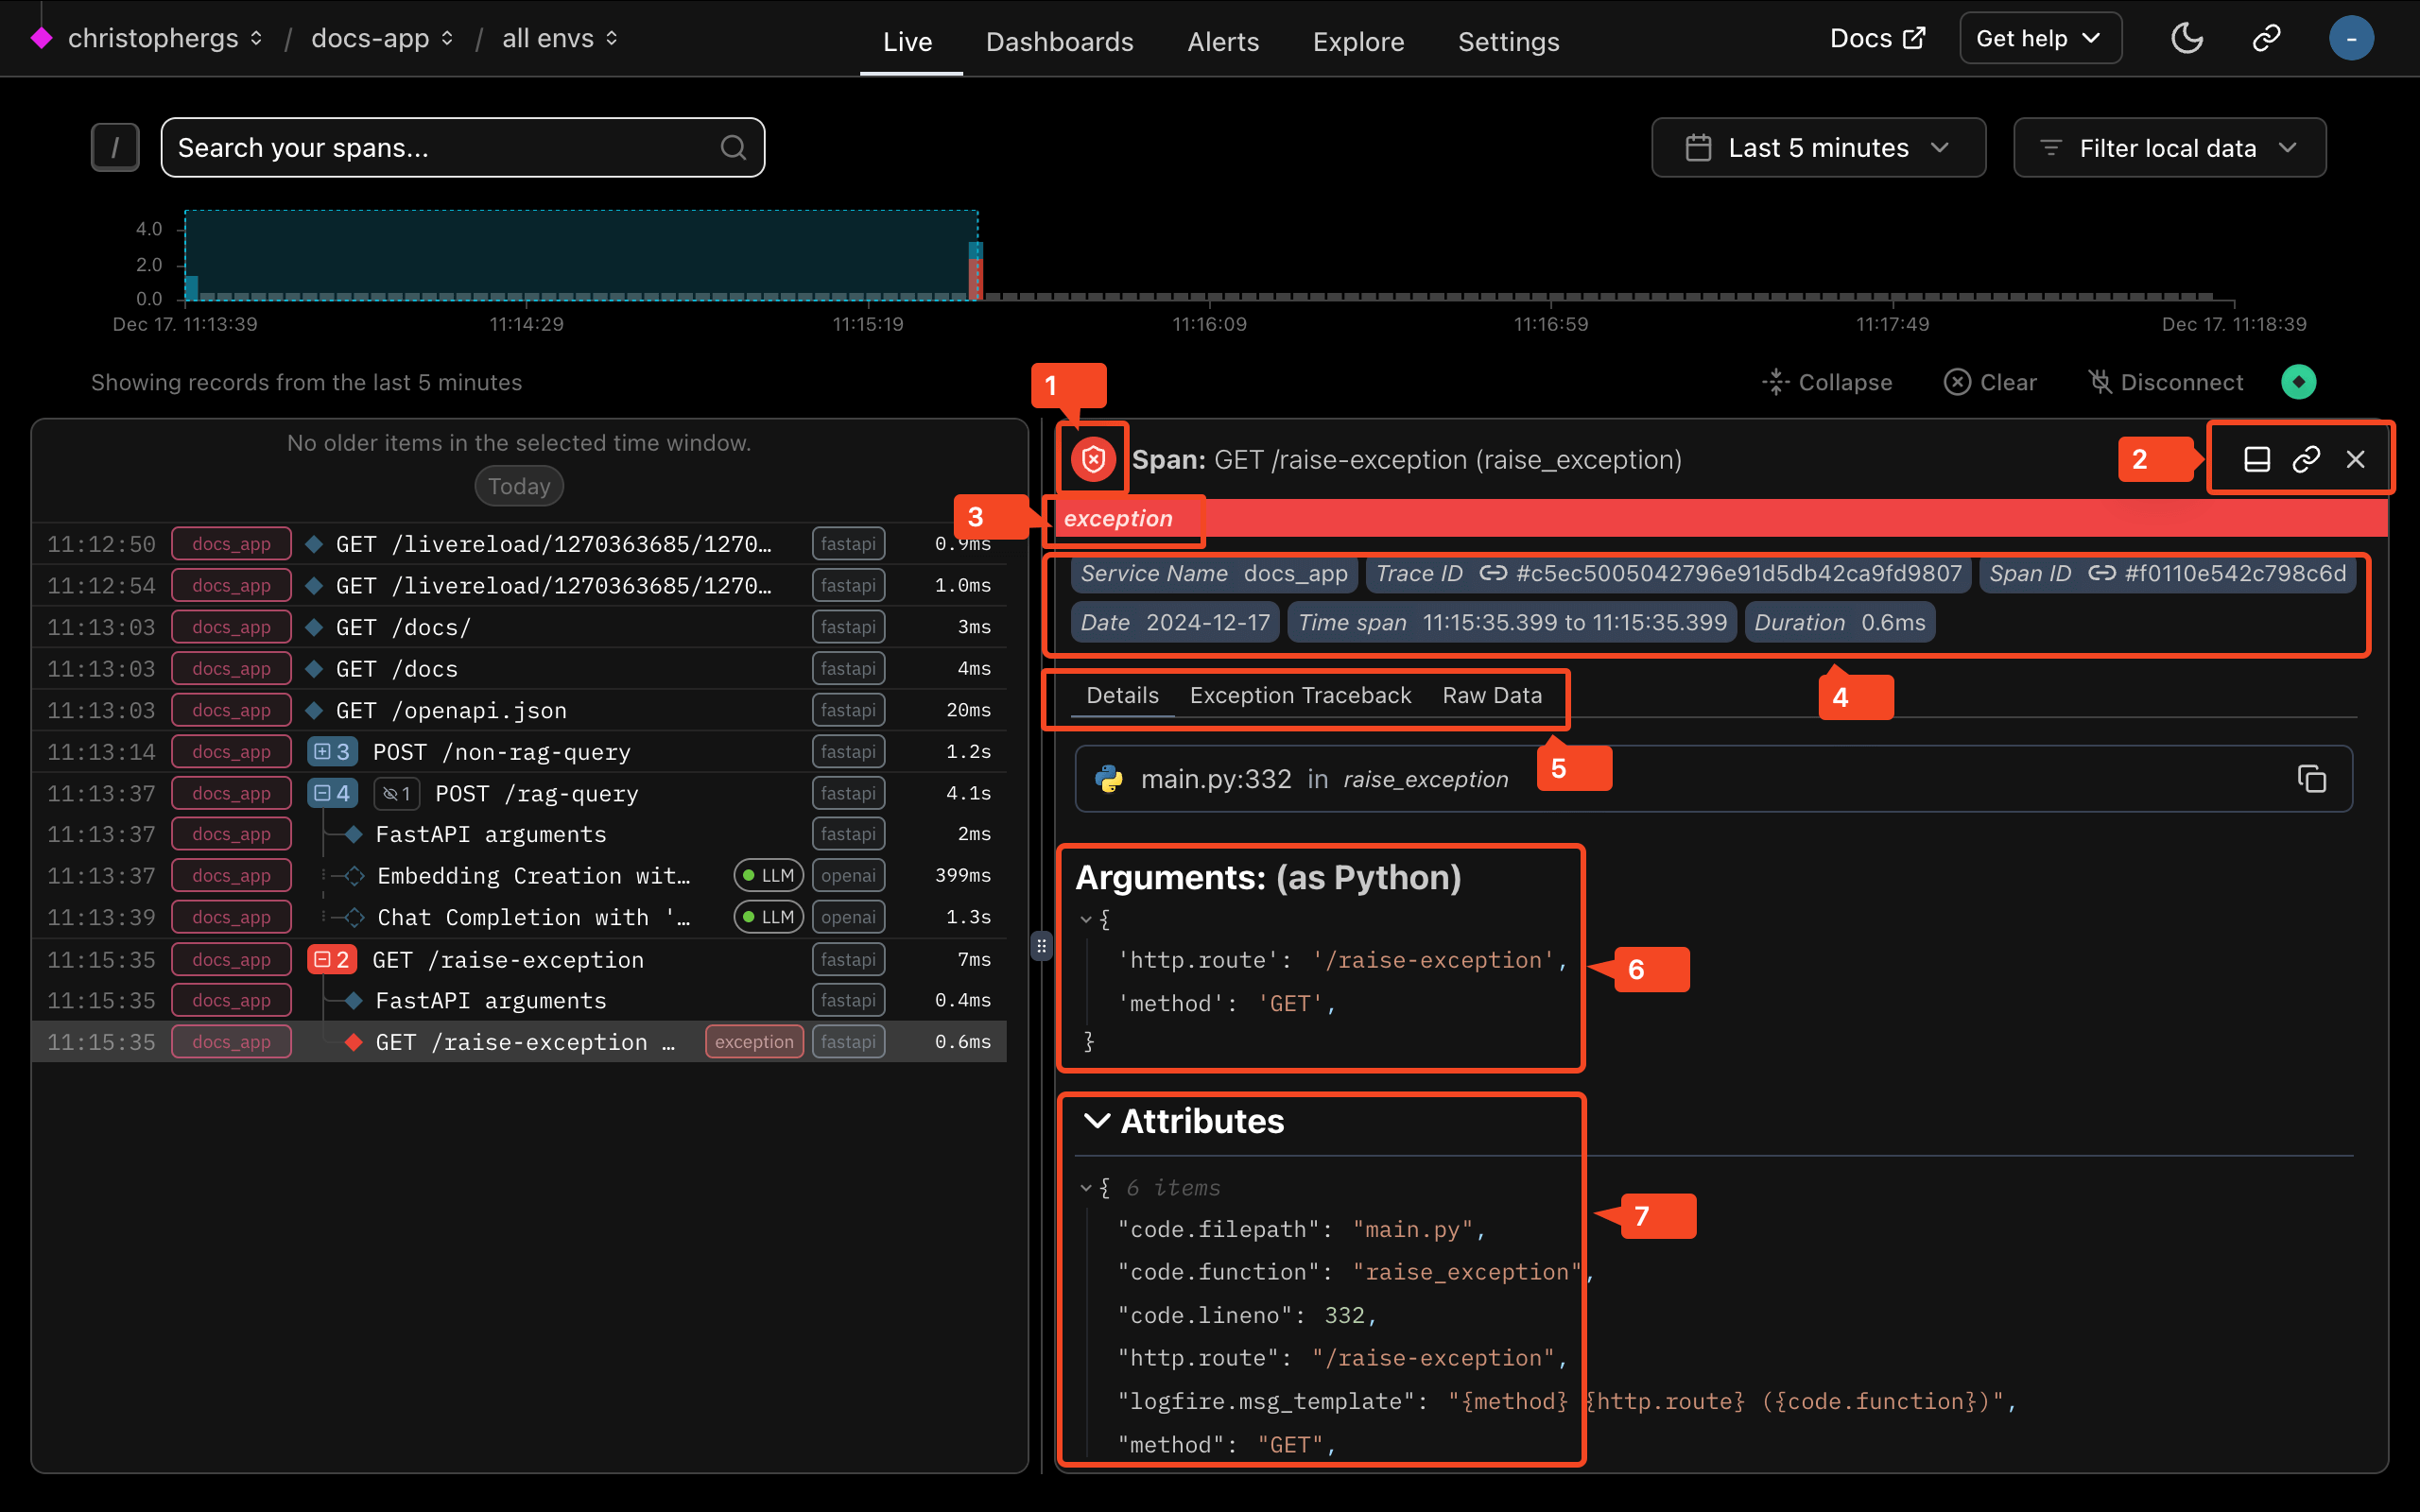
When you click on a span in the Traces Scroll, it will open the details panel, which you can see here.
-
Level icon: This icon represents the highest level of this span and any of its descendants.
-
Details panel orientation toggle, and other buttons: The second button copies a link to view this specific span. The X closes the details panel for this span.
-
Exception warning: This exception indicator is present because an exception bubbled through this span. You can see more details in the Exception Traceback details tab.
-
Pinned span attributes: This section contains some details about the span. The link icons on the "Trace ID" and "Span ID" pills can be clicked to take you to a view of the trace or span, respectively.
-
Details tabs: These tabs include more detailed information about the span. Some tabs, such as the Exception Details tab, will only be present for spans with data relevant to that tab.
-
Arguments panel: If a span was created with one of the logfire span/logging APIs, and some arguments were present, those arguments will be shown here, displayed as a Python dictionary.
-
Attributes: Full span attributes panel - when any attributes are present, this panel will show the full list of OpenTelemetry attributes on the span.